
The number everyone will quote from July is the median price: $566,500, down from $620,000 in June. That's the biggest one-month move in over a year, and on its own it sounds like the market fell out of bed.
Here's what actually happened: buyers changed what they bought. Sales of detached homes under $500K more than doubled compared to last July — 25 against 11. The middle of the market slowed, and condos nearly stopped, with just 2 sales all month. When the cheaper end does that much more of the volume, the median drops even if no individual home lost value. Price per square foot — which compares like to like — was $426 in July and $424 in June. Basically flat. It's down about 4.6% from last year, and that's the honest read on prices: drifting a little lower, not falling off a cliff.
Everything else about July looked steady. 109 homes sold, almost the same as last July's 111. The typical sale took 23 days — quicker than this time last year. And for the first time since early spring, the number of homes for sale stopped climbing: 568 now, down from 583 at the start of the month.
So that's July in one sentence: buyers didn't leave — they went hunting for value. The homes priced for today's market sold in about three weeks. The ones priced for a market that's gone made up most of the 169 listings that came off unsold. Your asking price decides which group you're in.
Watch this month's video report.
The most important stat this month.
169 homes came off the market in July without selling — against 109 that sold. For every two homes that found a buyer, three gave up. Most of them had the same problem, and it wasn't the house.
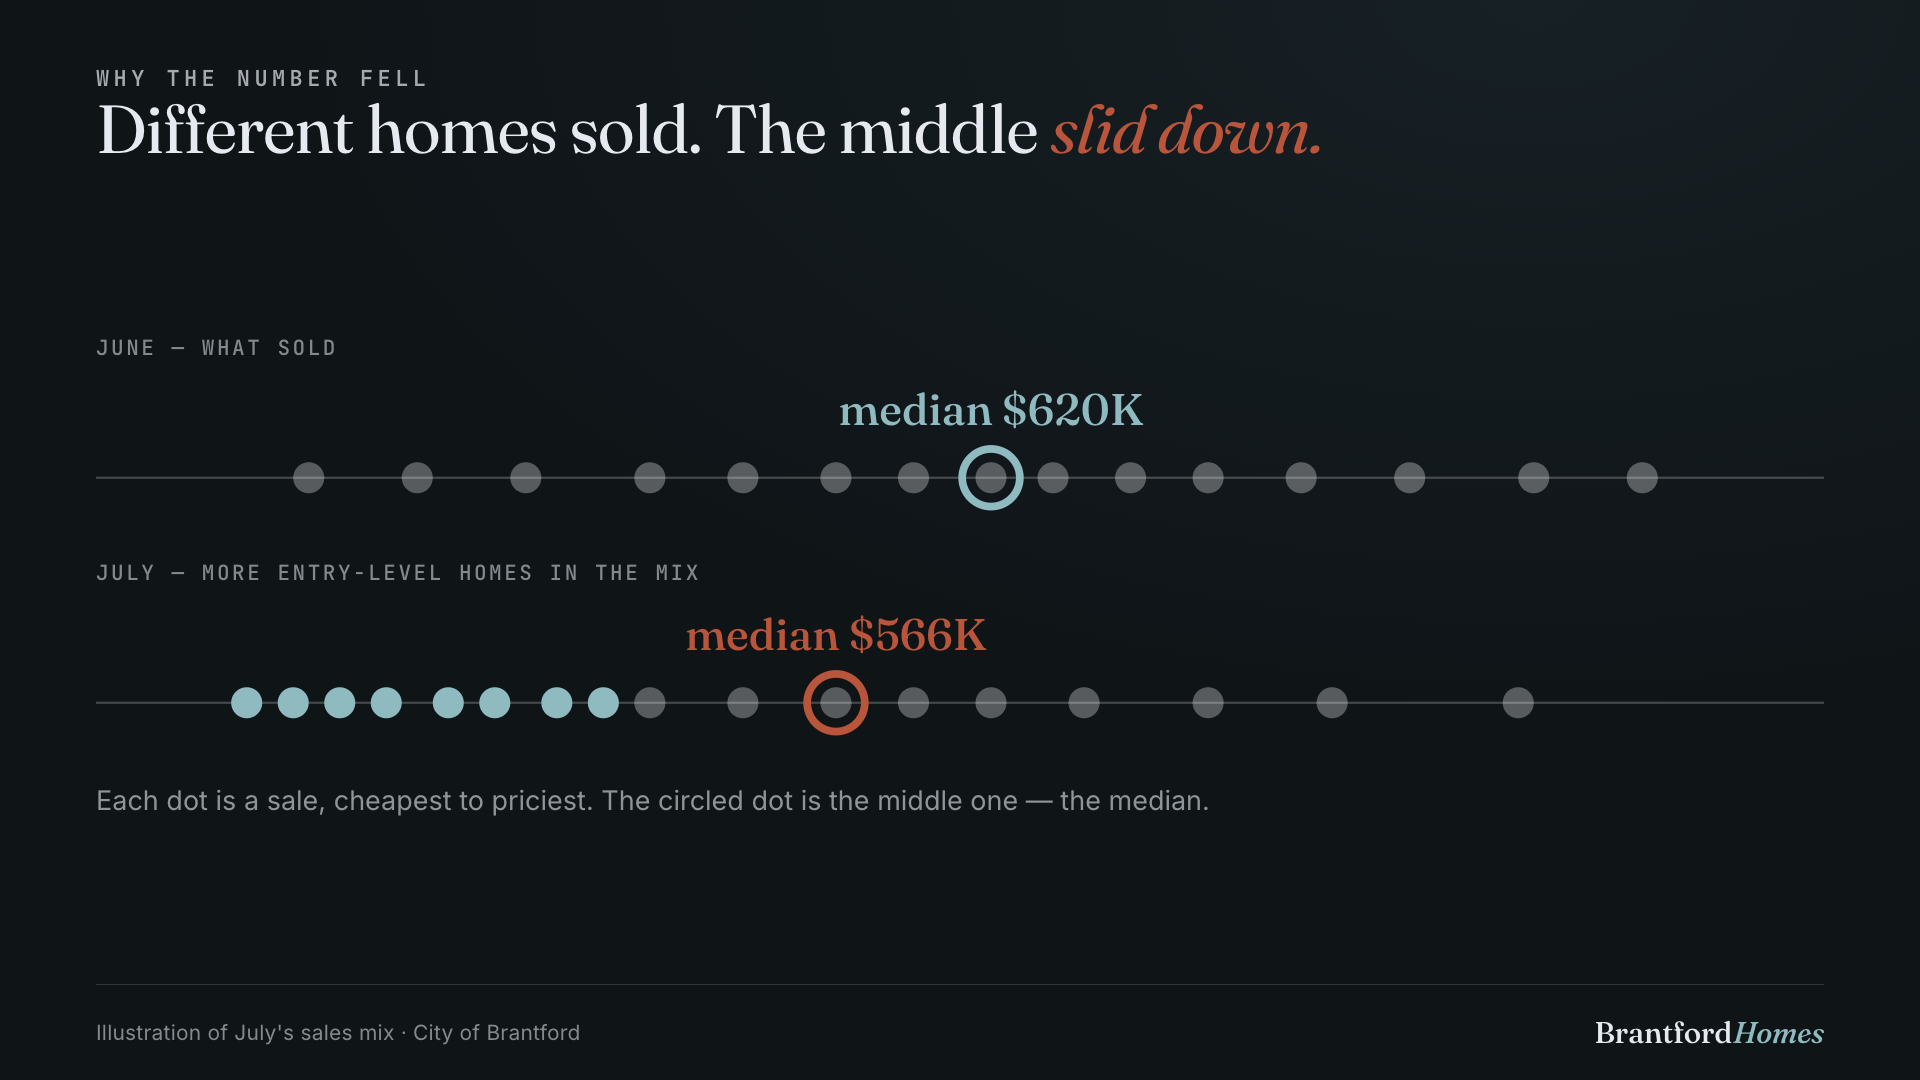
Different homes sold. The middle slid down.
Median sale prices can be misleading. They don't just move when the value of homes changes — they also move when the mix of homes that are selling changes. That's exactly what we saw in July.
Line up every July sale from cheapest to most expensive and the median is the one standing in the middle. This July, a wave of entry-level homes joined the line — detached sales under $500,000 more than doubled from last year — while the middle of the market slowed and condos nearly stopped. The middle home in the lineup moved down the ladder. That's the drop.
Buyers weren't suddenly getting the same house for $50,000 less. They were out there buying a whole different mix of homes — more entry-level, fewer mid-priced, fewer high-end. When that happens, the median gets pulled down. It doesn't automatically mean your home is worth any less.
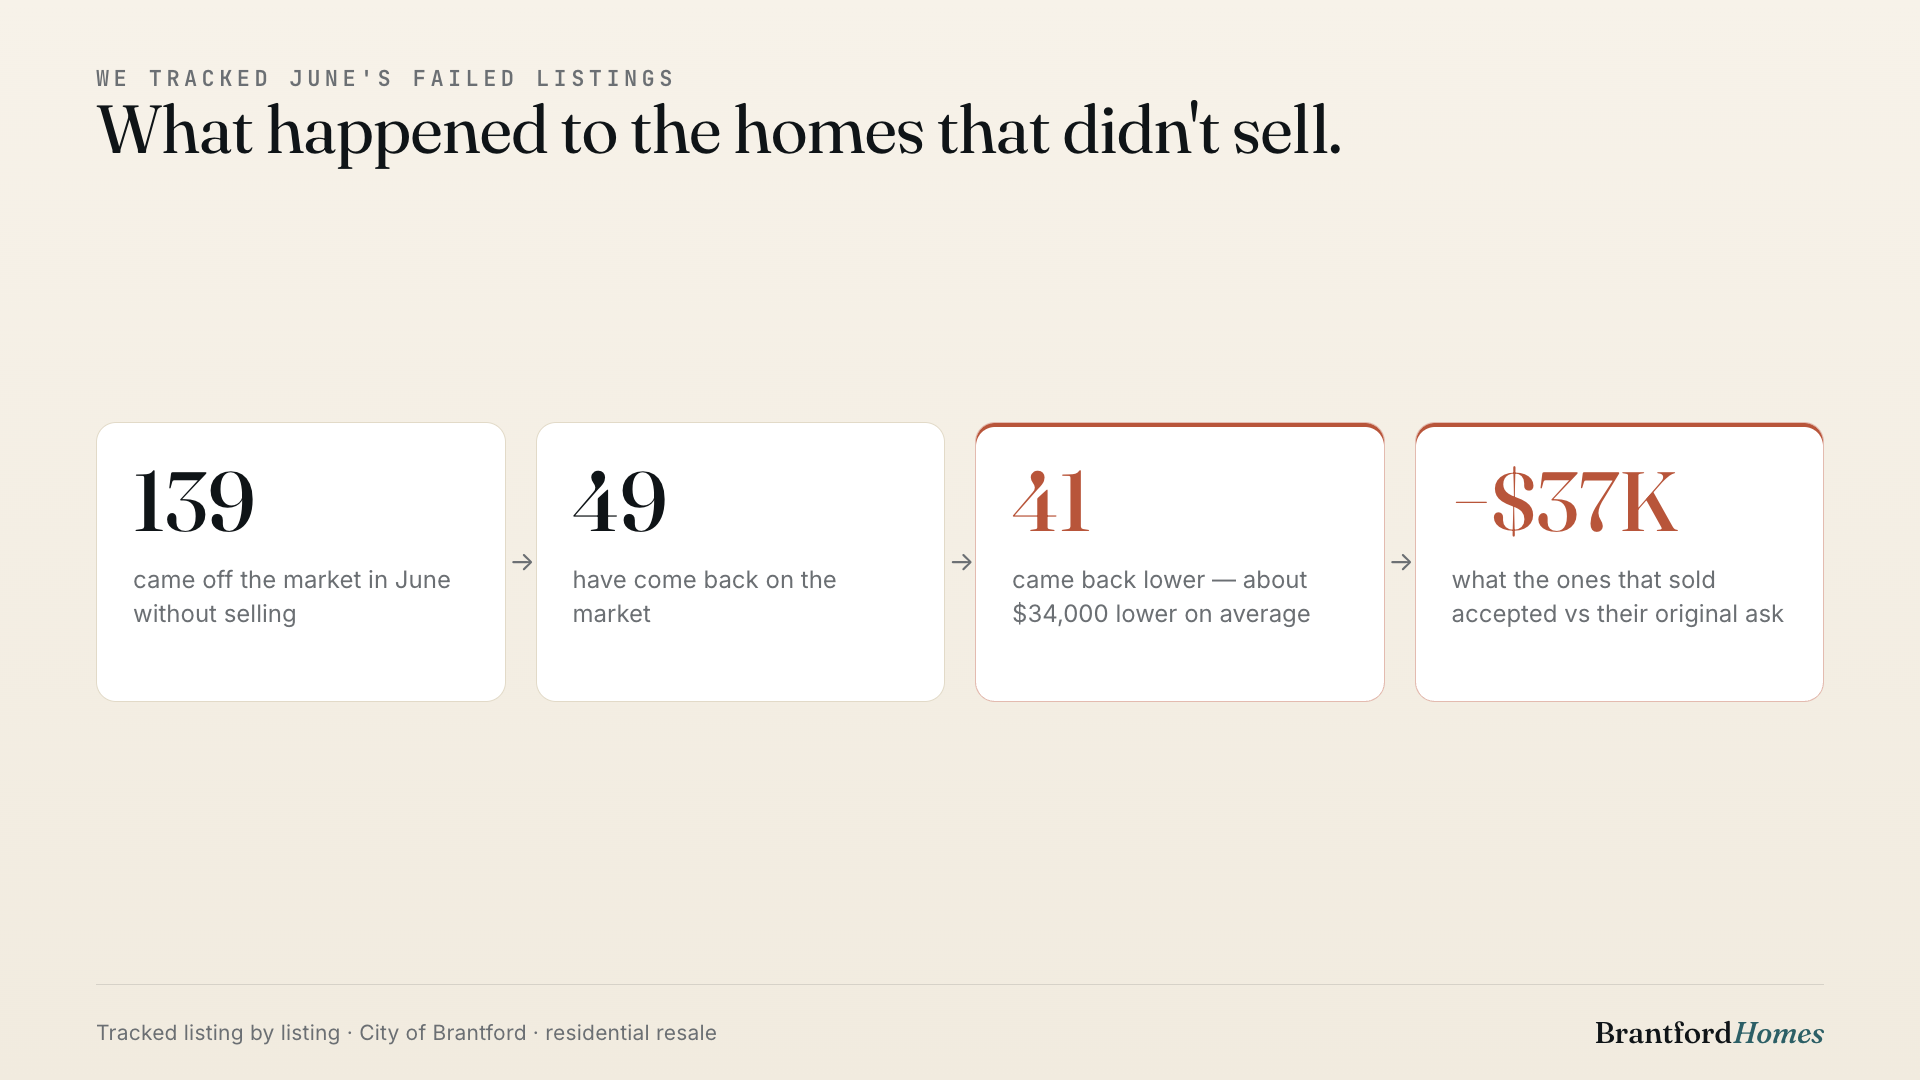
We tracked every home that didn't sell.
In July, 109 homes sold — and at the same time, 169 came off the market without selling. Last month we promised to follow June's failed listings one by one, and here's what happened next.
49 of them have already come back on the market. 41 came back at a better price — about $34,000 lower than their first try, on average. And the ones that have gotten the job done since relisting accepted roughly $37,000 less than their original asking price.
Sellers tell me all the time, "we can always come down later." The market usually gets you to your actual value eventually. The difference isn't the final price — it's the extra months of showings, stress, and uncertainty it takes to get there. The sellers who nailed the number the first time got the job done.
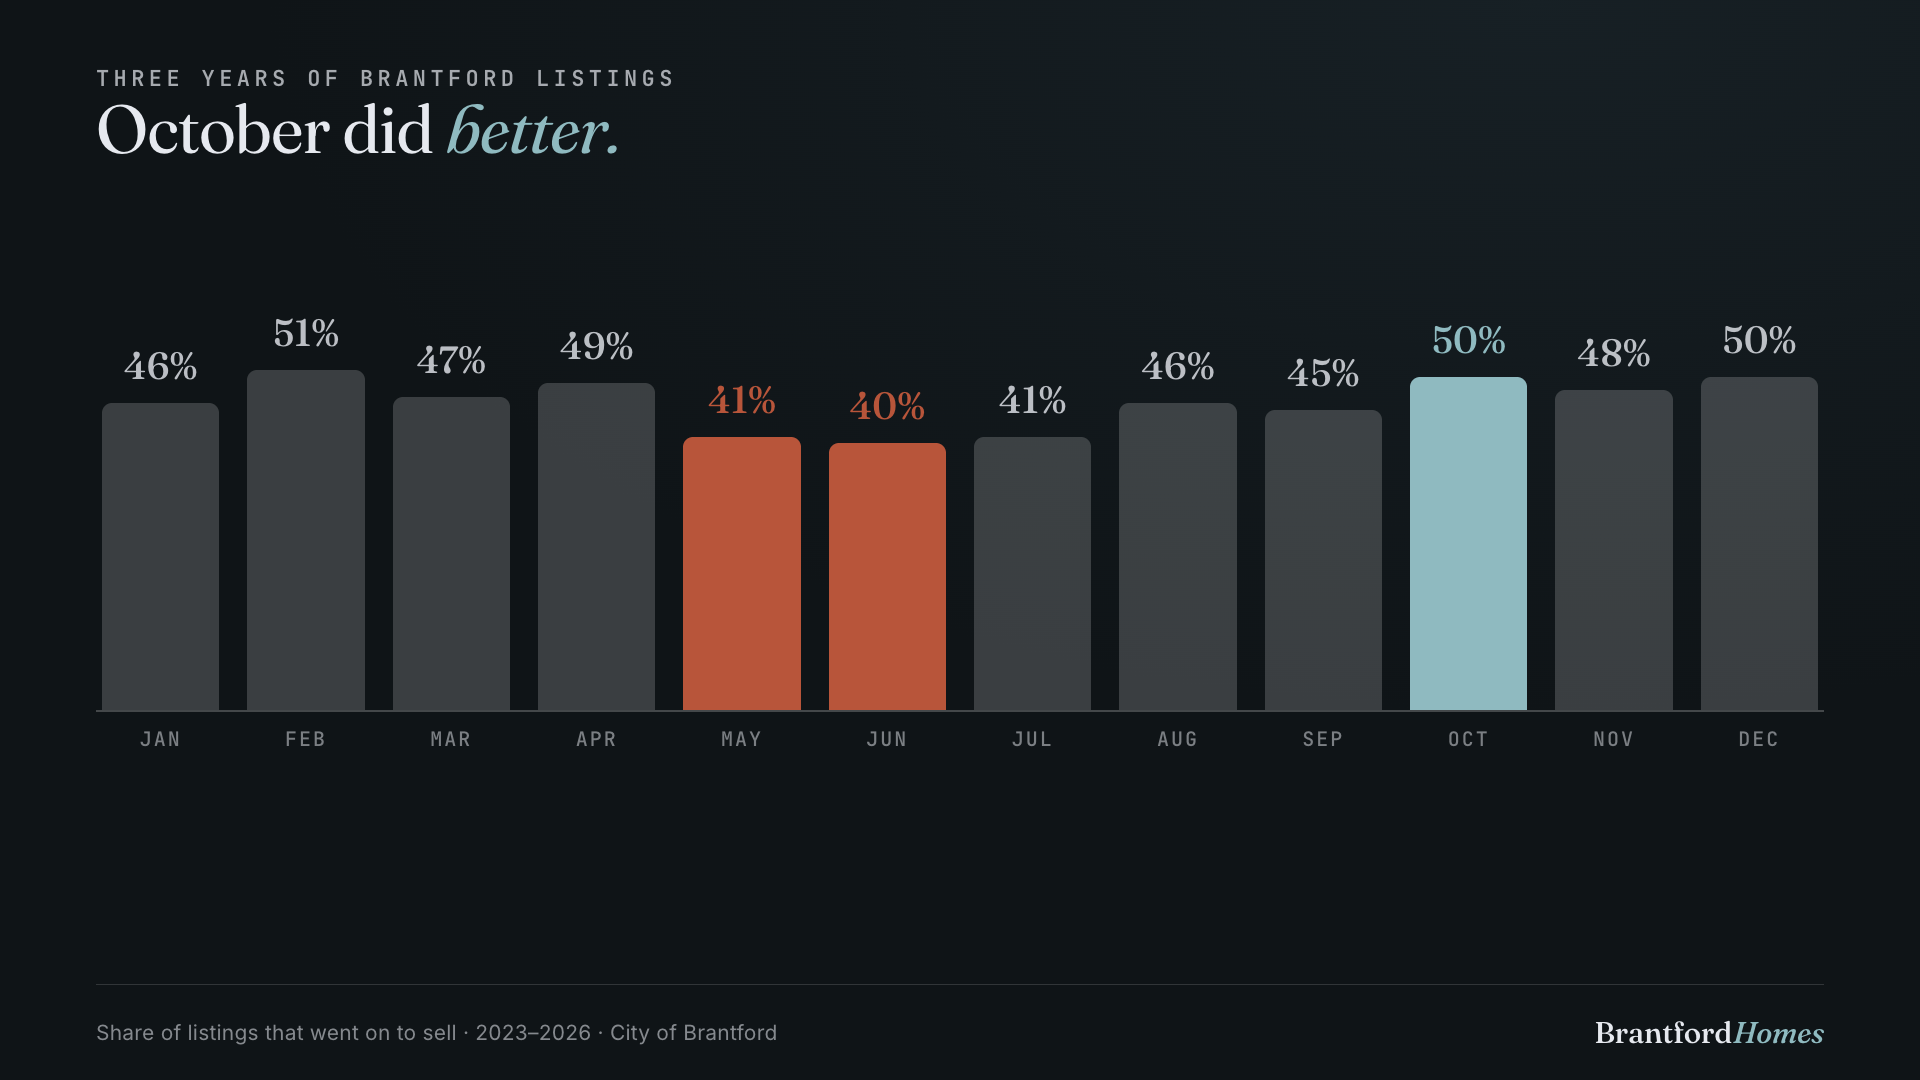
Should you wait until spring? I checked.
This is the question I get asked more than any other in August, and for years I probably would have said yes — wait for spring. Then I went back through three years of Brantford listings, every single month, and what I found surprised me.
Homes listed in May and June — when everyone thinks it's the best time to sell — had the lowest success rate of any months of the year. Homes listed in October did better. Not because October is magical, but because spring doesn't just bring more buyers; it brings even more sellers. In May you're competing with hundreds of other listings. By October, a lot of that competition has disappeared, and the buyers still shopping are serious — October listings sold just as quickly and just as close to asking as spring ones.
The lesson isn't "wait until October." It's that the competition in your marketplace matters a whole lot more than the calendar month. If you're ready to sell this fall, don't assume you missed your window.
What overpricing actually costs.
Every month a seller tells me some version of "we can always come down later." July put a price on later. Of June's failed listings that came back on the market, 41 of 49 came back lower — about $34,000 lower on average. And the ones that have sold since took roughly $37,000 less than their original ask. Later isn't a strategy. It's a discount with extra steps.
What happened to June's failed listings.
See the actual sold prices behind these numbers
Insiders see what every home really sold for the moment it sells — and can get an email whenever a home on their street lists, changes price, or sells. Like a stock ticker for your own home. Free.
What this means for you.
The first two weeks tell you everything.
There are 568 homes for sale and buyers are comparing, not chasing. Three things have to work together:
- Price to what's selling in your range right now — not to what your neighbour got in the spring
- Show well. With 568 homes to choose from, buyers rule most of them out from the photos alone
- Watch the first two weeks. If the showings aren't coming, that's the market answering you
Here's what waiting costs. The listings that have cut their price have been sitting a median of 70 days — the ones that priced right from day one are selling in about a month. And of June's failed listings that came back on the market, most came back about $34,000 lower. The market told them the number eventually. It just charged them two months of showings, carrying costs, and a stale listing to hear it. If you're not sure what the right number is for your street, that's exactly the question I answer every week — ask me before you list, not after week six.
Your price range decides how much room you have.
If you're shopping between $650K and $800K, be ready to move. That range was the fastest in the city in July — the typical sale took two weeks and sellers gave up less than 2% off asking. Good family homes priced right still go quickly.
Under $500K, your competition doubled. That's where the value hunters went in July, and well-priced homes there are drawing multiple buyers again. Over $1M is the opposite: 4 in 10 of those sellers have already cut their price — by about $96,000 on average — and there's far more for sale than there are buyers. That's where patience pays.
Prices aren't crashing, so waiting for that isn't a plan. But for the first time in a while, the market is genuinely different depending on where you're looking. Knowing which market you're actually in — before you offer — is worth more than any national headline.
The monthly math.
Here's what the numbers mean for a real monthly payment. A variable mortgage now runs about 3.4% against roughly 4.0% for a five-year fixed — variable has stayed the cheaper option all summer, and with the Bank of Canada on hold, this is the math to plan around rather than a rate cut that may not come.
Where buyers can negotiate right now.
How much room you have to negotiate depends on where you're shopping. In July the tightest range was $650–800K — buyers there paid over 98 cents on the dollar and the good homes were gone in two weeks. The most room was above $1M, where 4 in 10 sellers have already dropped their asking price.
The most negotiating room last month was in the Under $400K and $800K–1M ranges, where buyers paid 95.8% of asking on average. The least was $650–800K at 98.2% — priced-right homes there are still going near ask. The cards below show the full picture for every range.
Your price range is its own market.
The busiest stretch was $500–650K with 36 sales, but the story of July is the $400–500K range — 27 sales, up from 21 a year ago, as buyers went looking for value. Meanwhile just 4 homes over $1M changed hands. Ask "how's the market?" and the honest answer is still: it depends what you're buying or selling. The gauge on each card shows where your range sits.
Property type matters too.
Detached houses, townhouses, and condos each have their own supply and demand. July's surprise was condos: 2 sales all month, with 62 apartment-style condos sitting for sale. One month is a small sample — but if you're selling a condo right now, price and patience matter more for you than for anyone else in the city. Anything with fewer than three sales is left off the cards to keep them honest.
Neighbourhoods aren't moving at the same speed.
West Brant had the most sales in July, with 31 homes sold. West Brant carried the city in July — 31 sales, up from 18 a year ago. The North End went the other way, 25 sales against 39 last July. Same city, opposite directions. That's why the city-wide numbers are a starting point, not the answer for your street — click your neighbourhood for its own picture.
Brantford City and Brant County are different markets.
They share an MLS board, not a market. The county is bigger lots, rural properties, a smaller buyer pool, and more unique homes. Country towns can swing more month to month because there are fewer sales — the trend matters, but the absolute count matters more.
The bigger picture.
Parked at 2.25% — stop waiting for the cut. The Bank of Canada held its rate at 2.25% on July 15 — the sixth hold in a row — and the tone has shifted from "when's the next cut" to "this might be it for the year." Most bank forecasters now expect no move through 2026.
Holding — but watch the factory jobs. Ontario's unemployment rate held at 7.0% in June, down from 7.8% a year ago, after two strong months that added 84,000 jobs.
A new 50% tariff lands August 19 — aimed at Ontario. The trade story got worse in July.
Ontario is quietly the only province where sales are growing. Here's a stat that surprises people: Ontario is the only province where home sales are forecast to grow in 2026.
The forecast said prices slip this year. That's what this looks like. CMHC's outlook still calls Ontario the only province where prices slip in 2026, with things steadying late in the year and recovering in 2027.
What I'm watching next.
First — how last month's watch items played out
Inventory stopped climbing — 583 became 568 — the first real dip since early spring. New listings slowed over the summer while steady sales kept chipping away. One month isn't a trend, but this is the number that decides the fall market, and it just blinked.
Prices bent, but didn't break — The median fell hard — $620,000 to $566,500 — but that was the mix of what sold, not a repricing. Price per square foot was flat against June and sits about 4.6% below last year. Sellers gave up a little more at the table too: about 97 cents on the dollar, down from 98. Drifting, not breaking.
The failed listings faced reality — June's unsold cohort settled at 139 once the late paperwork caught up (we said 153 last month — a few relisted or closed after the fact). So far 49 have come back on the market, 41 of them at a lower price, about $34,000 lower on average. The 6 that sold took roughly $37,000 under their old ask.
Jobs held, with an asterisk — Ontario's unemployment stayed at 7.0% in June after two strong months of hiring — still down from 7.8% a year ago. The asterisk is manufacturing, which lost 17,000 jobs nationally in June, right as new tariffs on vehicles take aim at Ontario's factory belt.
The Bank of Canada stayed put — Held at 2.25% on July 15 — the sixth hold in a row — and most forecasters now expect no move for the rest of the year. Nobody should be timing a purchase or a sale around a rate cut. Today's rates are the plan.
September inventory — the signal I care about most
Homes for sale finally stopped climbing in July: 583 became 568. Right now there are 2% more homes for sale than a year ago, and that gap has been shrinking. If September comes in below last year, the market is tightening heading into fall — and fall buyers will feel it.
Whether the failed listings come back
June and July together produced about 300 listings that didn't sell. History says many of them return in September and October — priced $30,000 or more below their old ask. Fall sellers won't just compete with new listings; they'll compete with repriced comebacks.
Condos
2 sales in a month is close to zero. It might be a summer blip. But with 62 apartment condos for sale, I want to see August before saying anything stronger.
The split at the top
$800K–$1M actually got healthier in July — more sales than last year, selling in half the time. Above $1.25M, one home sold all month against 49 for sale. Two different markets wearing the same label. I'm watching whether fall brings those sellers down to where buyers are.
Jobs and the new tariffs
Ontario's unemployment held at 7.0% in June, but manufacturing shed jobs nationally — and a new round of US tariffs on vehicles, dairy, and alcohol lands August 19. Confidence here tracks work more than rates. This is the cloud on the fall.
Frequently asked questions.
Questions I get asked all the time.
These are the actual questions buyers and sellers ask me every week. Straight answers, with the latest numbers. Updated each month.
In July 2026, the median home in Brantford sold for $566,500 — half sold for more, half for less. That's lower than June's $620,000, but most of the drop came from more entry-level homes selling rather than prices falling. Measured per square foot, prices are about 4–5% below last year.
The final takeaway.
July's scary headline wasn't real, and July's real story wasn't in the headline. The median dropped because buyers moved down-market, not because homes lost 9% of their value in a month. What's actually true: prices are drifting about 4–5% below last year, well-priced homes are selling in three weeks, and the pile of listings that asked too much keeps growing.
If you're thinking about selling this fall — and the data says fall is a better window than most people think — the whole game is the number you launch at. Homes priced right sold in 23 days in July. Homes priced wrong joined the 169 that came off the board.
If you want to know where your home actually sits in this market, send me your address and a rough timeline. I'll give you an honest first read on the likely range — no cost, no listing agreement, no pressure to do anything with it. That's the same first step every one of my clients starts with.
Want a read on your specific situation? Reach out.